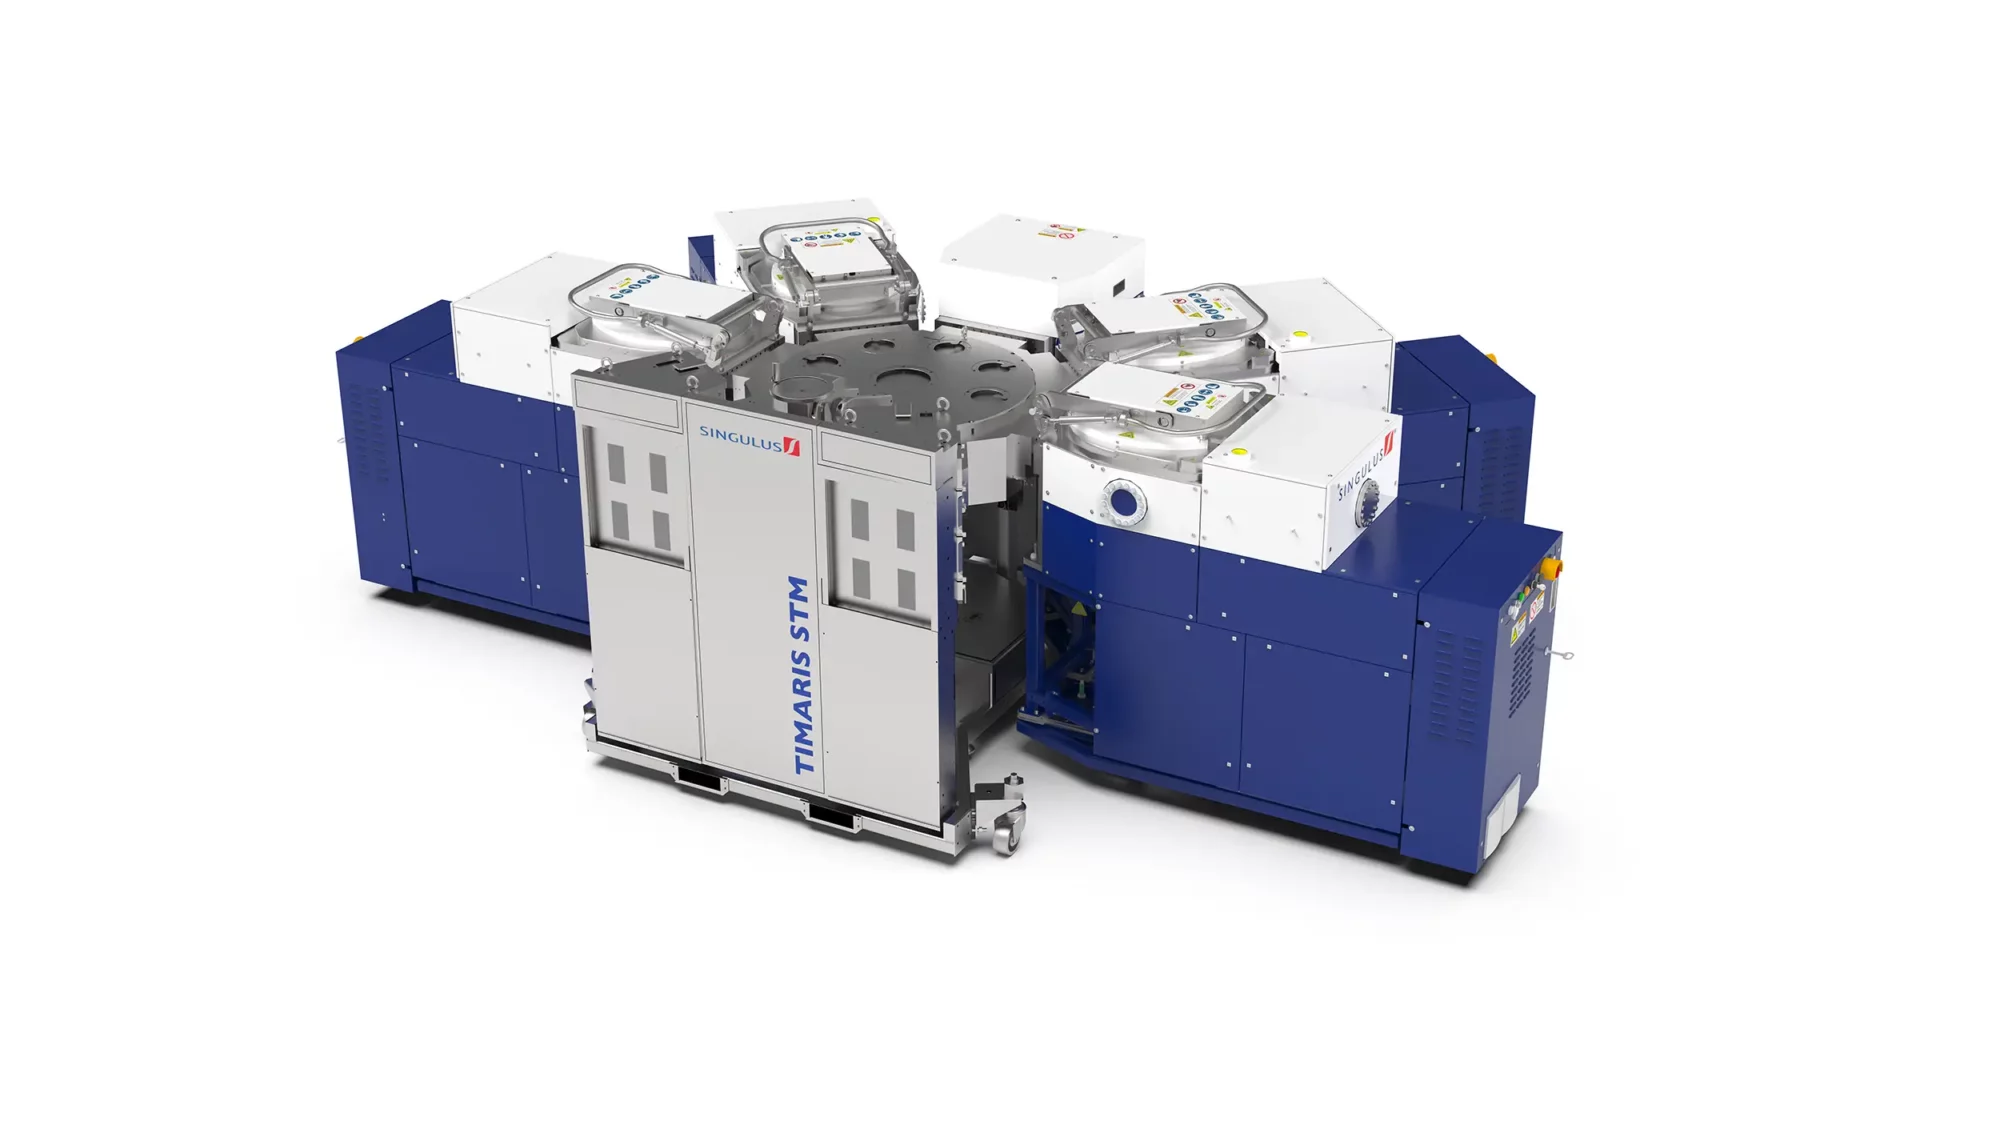
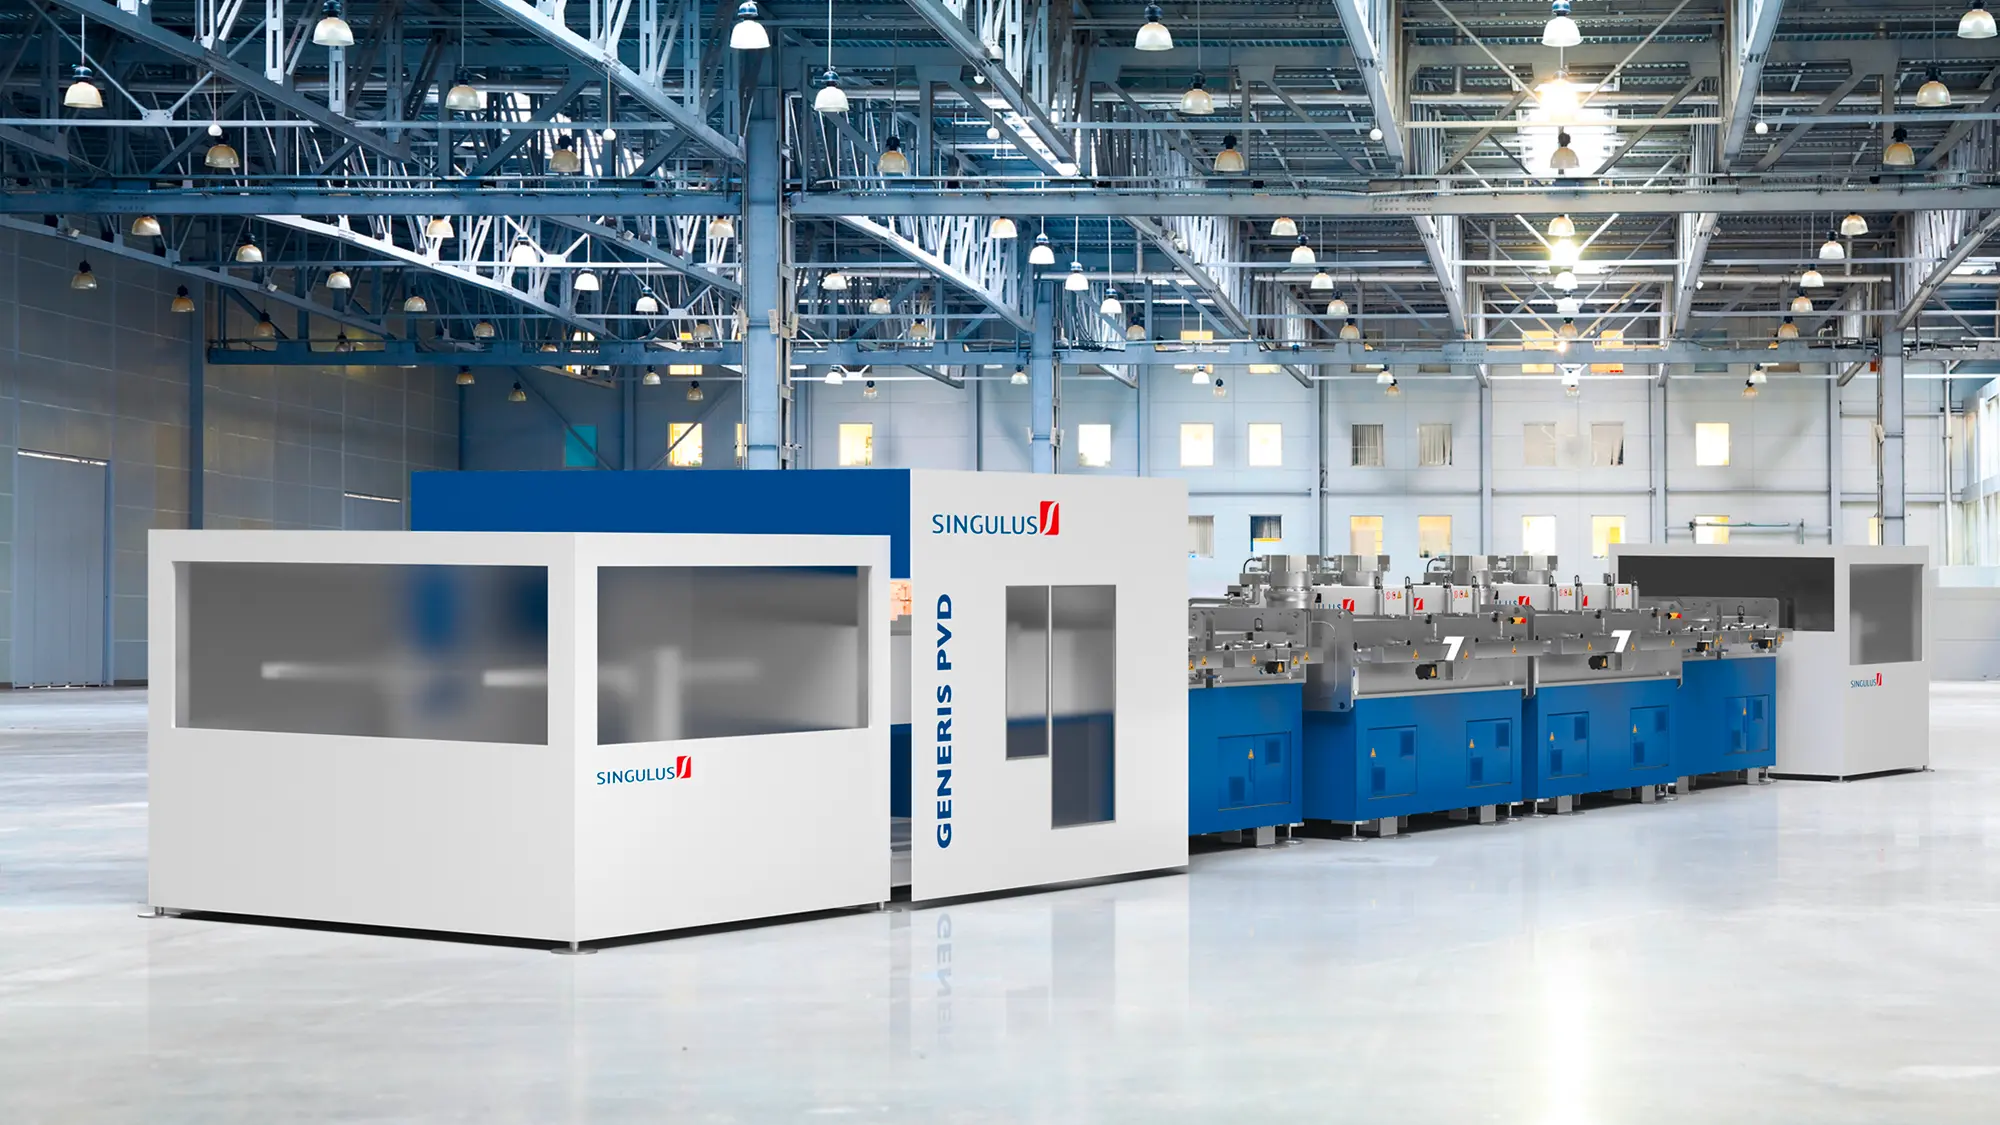
Key Figures

The consolidated financial statements of the years 2005 to 2010 were drawn up pursuant to the International Financial Reporting Standards (IFRS).

    2005 2006 2007 2008 2009 2010
Sales (gross) in mn. € 244.4 283.1 229.5 212.1 116.6 120.1
Sales (net) in mn. € 232.3 272.5 223.0 207.9 115.0 118.2
- Sales Germany % 13.3 11.7 11.3 12.3 18.4 25.1
- Sales Rest of Europe % 36.5 30.2 28.6 27.1 24.3 22.9
- Sales Americas % 20.1 28.0 32.1 33.1 23.3 26.6
- Sales Asia % 24.4 27.5 25.9 27.0 32.7 20.0
- Sales Africa/Australia % 5.7 2.6 2.1 0.5 1.3 5.4
Order intake in mn. € 248.7 319.0 203.8 226.4 81.1 128.2
Order backlog (31.12.) in mn. € 60.9 81.5 55.8 70.2 34.7 35.5
EBIT in mn. € 2.1 4.0 1.1 -46.2 -73.2 -80.2
EBIT margin % 0.9 1.5 0.5 -22.2 -63.7 -67.8
Earnings before taxes in mn. € 3.3 4.3 1.6 -54.1 -79.4 -84.9
Net profit in mn. € 7.3 11.1 3.0 -49.3 -78.9 -77.9
Operating cash flow in mn. € 8.3 9.0 -3.6 -12.4 0.2 -6.9
- in % of net sales % 3.6 3.3 -1.6 -6.0 0.0 -5.8
Tangible assets in mn. € 12.9 22.3 12.5 10.3 12.3 10.6
Financial assets in mn. € 31.2 31.2 76.8 66.4 42.5 21.7
Current assets in mn. € 238.8 248.2 212.1 219.2 114.3 107.3
Shareholders' equity in mn. € 255.5 274.7 293.3 245.5 165.8 106.2
Equity ratio % 71.0 69.1 66.1 57.8 62.9 58.4
Balance sheet total in mn. € 359.9 397.6 443.9 424.6 263.6 181.9
Research & Development in mn. € 19.4 23.5 25.6 20.1 15.1 11.0
- in % of net sales % 8.4 8.6 11.5 9.7 13.1 9.3
Employees (31.12.)   636 796 764 722 572 459
Weighted average shares
outstanding, basic
  35,065,241 34,941,929 35,610,088 36,946,407 37,294,111 40,383,023
Weighted average shares
outstanding, diluted
  35,065,241 35,015,262 37,194,844 36,946,407 37,294,111 40,383,023
Stock price at year-end 14.50 12.13 6.97 3.50 3.07 4.48
Earnings per share 0.21 0.35 0.05 -1.32 -2.11 -1.92